We all understand that even in those moments when the market is clearly moving in one direction in different areas of our metropolis, prices change in different ways. If we talk about what happened with Toronto GTA Real Estate in 2017, it gets even worse, because sometimes the market moved in absolutely opposite directions. So it became interesting to me, how unevenly had the prices changed? Based on this, a question arises – how different is the price for the same types of real estate in Toronto GTA.
Therefore, I bring to your attention a blog called “Mini Maxi”. You will find out where are the most expensive and cheapest apartments in our metropolis, as well as which areas of Toronto GTA changed most in price in 2017.
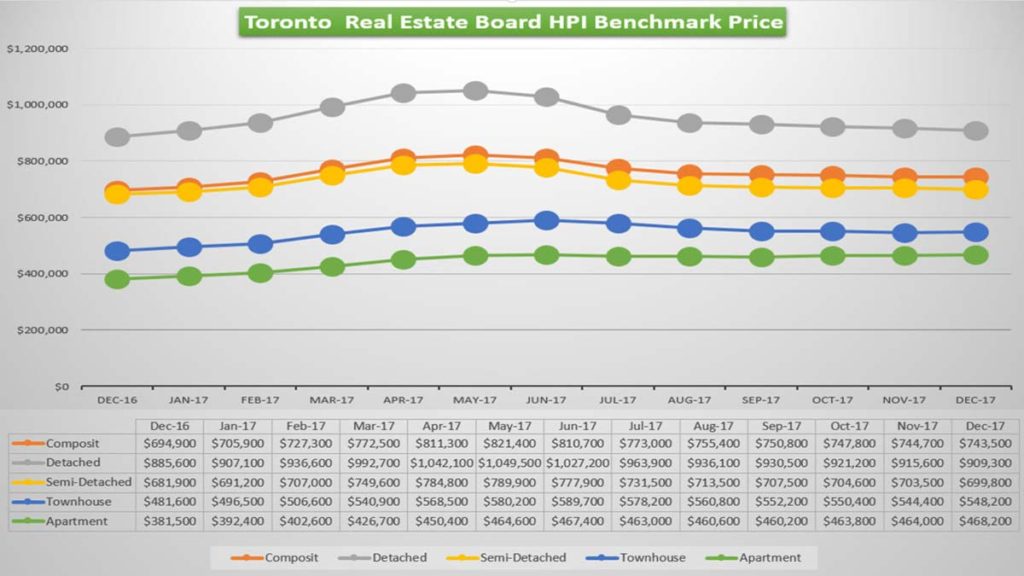
TREB MLS Home Price Index (HPI) Benchmark
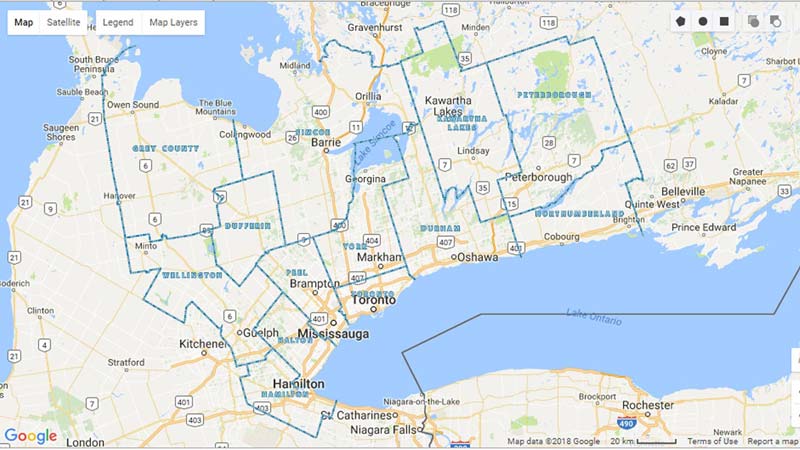
In order to find out how much a similar property can vary depending on its location, I turned to the statistics prepared by TREB (Toronto Real Estate Board). In particular to the TREB MLS HPI Benchmark. HPI (Home Price Index) is an indicator that takes into account not only the price of a real estate object and its type, but also some characteristics of this property. Among these characteristics, you can distinguish such as the area square footage, number of bedrooms, bathrooms, garage, age of the structure, location, etc. and compares this average type of real estate with the actually sold. This allows you to smooth out the current situation, when too cheap or too expensive real estate objects were sold, while having a significant impact on statistics.
Cheapest and Most Expensive Municipality
Cheapest
$350,000
Brock

Average Price HPI
$743,500
Toronto GTA
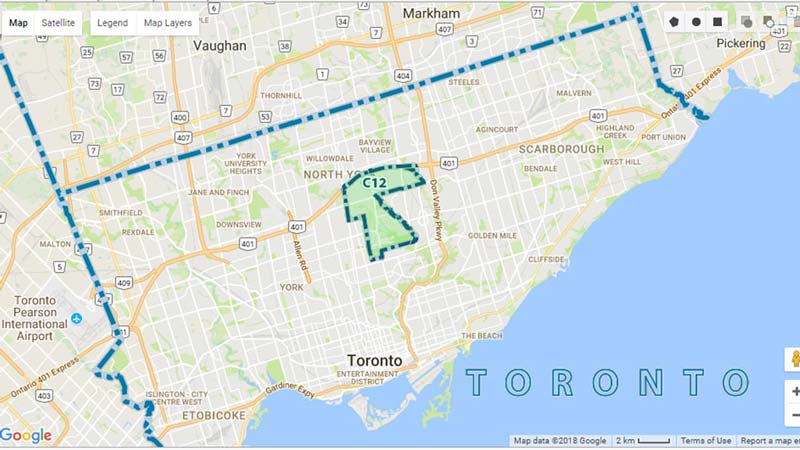
Most Expensive
$1,844,600
Toronto C12
Cheapest and Most Expensive Neighbourhood
Cheapest
$312,100
Beaverton

Average Price HPI
$743,500
Toronto GTA
Most Expensive
$3,069,700
Devil’s Elbow

Cheapest and Most Expensive Detached Homes
Cheapest
$315,900
Brock
Average Price HPI
$909,300
Toronto GTA
Most Expensive
$3,074,600
Devil’s Elbow
Cheapest and Most Expensive Semi-Detached Homes
Cheapest
$332,800
Oshawa Central

Average Price HPI
$699,800
Toronto GTA
Most Expensive
$1,820,300
Forest Hill South

Cheapest and Most Expensive Townhouses
Cheapest
$222,800
Oshawa Lakeview

Average Price HPI
$548,200
Toronto GTA
Most Expensive
$1,435,000
Rosedale-Moore Park
Cheapest and Most Expensive Apartments
Cheapest
$161,500
Elms-Old Rexdale

Average Price HPI
$468,200
Toronto GTA
Most Expensive
$978,800
Bridle Path-Sunnybrook-York Mills

Are Prices Rising or Falling?
Now let’s talk about what excites everyone and causes the most fierce debate – are Property prices in Toronto GTA Rising or Falling? Maybe the first and the second at the same time?
First, let’s take a look at the chart that I prepared. It is very easy to see how the average price of HPI has changed during 2017. You can track not only how the price of Composite has changed, i.e. on average for all types of real estate, but also separately by segment.
Worst and Best Price Changes by Municipality
Worst
-3,53%
Whitchurch-Stouffville

Average
+7,19%
Toronto GTA
Best
+19,93%
Toronto C01

Worst and Best Price Changes by Neighbourhood
Worst
-13,81%
Crosby (Richmond Hill)
Average
+7,19%
Toronto GTA
Best
+26,96%
City Centre (Mississauga)
Worst and Best Price Changes for Detached Homes
Worst
-14,55%
Crosby (Richmond Hill)
Average
+2,33%
Toronto GTA
Best
+17,24%
Rural Scugog
Worst and Best Price Changes for Semi-Detached Homes
Worst
-16,35%
Crosby (Richmond Hill)
Average
+2,81%
Toronto GTA
Best
+17,09%
LaSalle (Burlington)
Worst and Best Price Changes for Townhouses
Worst
-9,77%
Williamsburg (Whitby)
Average
+10,96%
Toronto GTA
Best
+56,41%
Cornell (Markham)
Worst and Best Price Changes for Apartments
Worst
-1,35%
Hurontario (Mississauga)
Average
+21,83%
Toronto GTA
Best
+52,69%
Malvern (Toronto E11)
Well, how do you like such data? Personally for me, it was very unexpected. I always said that the real estate market in Toronto GTA, is developing unevenly and it is therefore very important to conduct analysis and view statistics, not relying solely on your perception. But that same segment could and fall by 10% and grow by 56%, depending on the area …
This is for when people say – “Oh, do not tell me and show your statistics. It’s all a fake, I can see with my own eyes ….” Yet I don’t think that someone with their own eyes sees 87,000 sales a year.
Good luck to all!
Please, leave your comments and share your ideas!
- 133 Aishford Rd., BradfordMeet my New Listing
- 949 Langford Blvd, BradfordGorgeous 2 Yrs New Home on Huge Premium Corner lot with 134′ depth, 45’ front and 79’ back!
- 25 Deer Hollow Crt, Bolton, Ontario, L7E 1T2Very Rarely Can You Purchase A Home Like This One! Backing Onto Ravine! Great Neighbourhood With Walking Trail And Park. This True Entertainer’s Home