October is one of the key months for the Real Estate Market. For this reason, the date we received in October will be incredibly important for us to understand what is going on the Toronto GTA Real Estate Market and forecast the development of the situation.
Well, what interesting has happened in October 2017? Actually many things, starting from the point that Sales were up by 12% compare to the previous month and that the Average price raised again. Do you want to know more? Let’s continue …
1. Sales
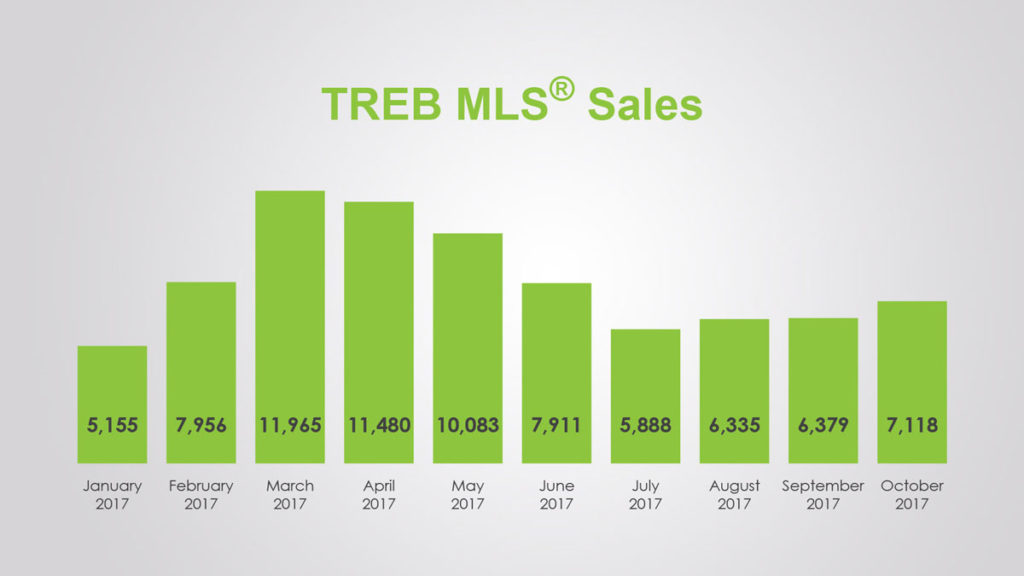
Total Sales for the first ten months of 2017 amounted to 80,198
down 19.2% from 99,233 sales for the same time period in 2016.
Sales were down, but …
Number of Sales for Toronto GTA in October 2017 amounted 7,118, that’s 26,7% less than in the same month of super-hot 2016.
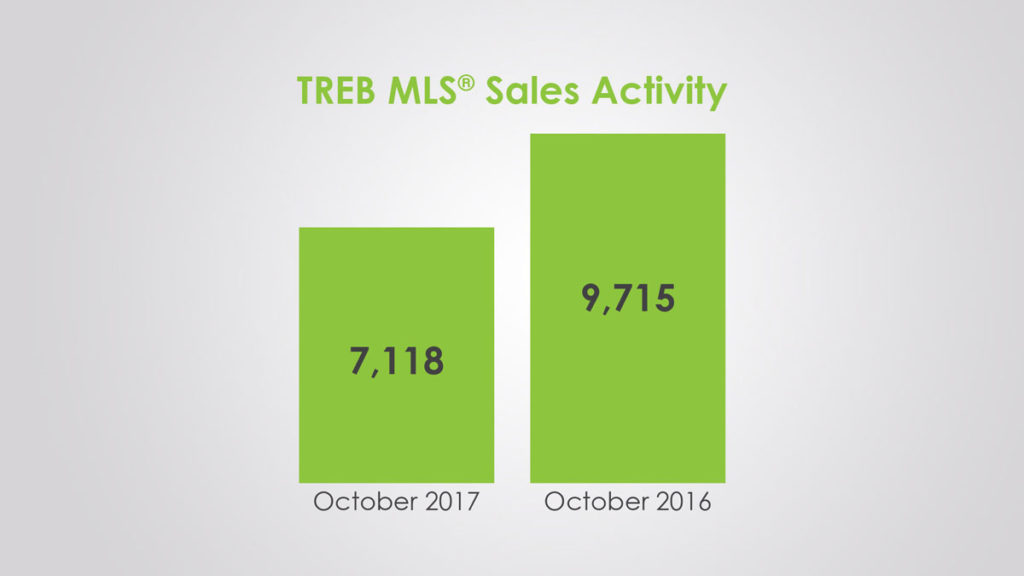
… Sales Grow for the third consecutive month.
What pleases me is that sales have increased relative to the previous month. At what, have grown noticeably – on 11,5%. Moreover, sales are growing relative to the previous month, the third month to a number. What can better testify to the fact that the market has turned from falling to growth. I am not saying that significant growth is expected, but it already exists.
With those who say that it is logical that sales grew in October, compare to September, I will agree. Nevertheless, at the same time, it should be noted that the growth rate of sales in October 2017, was much higher than usual growth for this period over the last decade. At the same time, I want to remind you that, for example, last year, the number of sales in October fell, relative to September. In my opinion, this indicates that the market has recovered from the innovations of Government regulators and stabilized in September, cheerfully continued to move forward.
Everything becomes much more interesting if you look at the layout of the segments where the demand began to shift towards Low Rise segment. Which is not surprising, if you look at the price dynamics in the High-Rise and Low-Rise segments.
2016 was a record year in terms of Sales
That is the thing, I keep reminding everyone who is dejected by the decline in performance and continues to talk about the unfavorable situation in the real estate market of Toronto GTA.
If you compare the results of October 2017, with the average for the last decade (7599), then you will see that Sales sagged by only 6.75%. I think you will agree that nothing terrible has happened. Moreover, this is a significant improvement, relative to the indicators of recent months.
| Sales Toronto | Sales GTA | Sales Toronto GTA | |
|---|---|---|---|
| Detached Change year-over-year | 812 -25.0% | 2,323 -31.4% | 3,135 -29.8% |
| Semi-Detached Change year-over-year | 284 -17.0% | 410 -27.4% | 694 -23.5% |
| Townhouse Change year-over-year | 284 -21.1% | 867 -22.2% | 1,151 -22.0% |
| Condo Apartment Change year-over-year | 1,485 -21.4% | 540 -33.0% | 2,025 -24.9% |
Analysts say …
Analysts say that the pressure to lower prices occurs when the ratio of active listings to Sold is less than 12% for a sufficiently long period. At the same time, if this figure is above 20% for several months in a row, then prices are rising.
As you can see for yourself in Toronto GTA, this indicator is at a level of more than 37%.
Thus, the indicators show that all measures introduced by the Ontario and Federal Governments are gradually coming to naught and the market continues to recover, largely showing itself in the same way as the Vancouver Real Estate Market.
2. Active Listings
The number of Active Listings is what determines how wide is the choice of properties for Sale for Buyers. Of course, the more choices, the more comfortable the position of the Buyer and vice versa, the lower the supply on the market, the stronger the position of the Seller.

The number of Active Listings on the market of Toronto GTA in October 2017 was at the level of 18,859 units.
This is almost twice as much as it was a year before, and to be precise, the Number of Active Listings increased by 78.5%. In comparison with the previous month, this indicator decreased by 162 units, i.е. in practical terms has not changed. Already for half a year, the Number of Active Listings, is right at the threshold of the indicator of a balanced market in 20 000 Active Listings, while practically not crossing it.
In general, everything is fine. To those who think that everything is bad, I want to say that you are just used to the time when it was too good. Just for 3 years, we lived in another reality, and so we got used to thinking that this is normal.
3. Sales to New Listings Ratio
47.76% – Sales-to-New-Listings Ratio (SNLR) for October 2017.
7,118 residential properties were sold in Toronto GTA during October 2017. At the same time, the Number of New Listings for sale amounted to 14,903 units. Thus, 7118/1493 = 47.76%.
If you look at the graph, you will see that this indicator is gaining momentum. After the fall in May to 39%, which clearly signals that the market favors Buyers, the situation began to gradually return to normal. The only thing that gets out of the picture is a sharp splash in August and a similar cutting in September. However, in my opinion, this is easily explained by the fact that in August sales began to grow, but the new listings did not hurry to go on sale and their number decreased to 11,523 units. As a result, the SNLR jumped to 55%. Nevertheless, in view of this, with the advent of September, the deferred proposal poured into the market, which resulted in 16,500 New Listings. As a result, SNLR sagging in September to 38.7%. But if the data of these two months lead to an average, then we will get 46.9% and then it can be treated as an ongoing trend.
In general, the Real Estate Market of Toronto GTA, has rebounded and is gaining momentum.

4. DOM
Average DOM for October was 23 days
In October 2016, the property Sold on average in 16 days. In the past month, the average selling time was 23 days. The increase in the Average Time of selling is 44%, this is certainly not good. However, if you look at the average value over the last decade, you will find that it usually took 26 days, it turns out that the houses are sold quite quickly.
5. MOI — Months of Inventory

Months of Inventory indicator in October 2017 is on the level of 2.6
Of course, in recent months, this indicator has grown significantly and this shows some cooling of the market. At the same time, at first glance, this indicator is quite volatile. However, if we average the August and September data, when, as in the case of the indicator for Sales to New Listings Ratio, some imbalance was noted, the picture is leveled and forms a good stable trend, indicating the intensification of activity in the Toronto Real Estate Market of GTA.
Moreover, it should be noted that the indicator Months of Inventory at the level of less than 3 months, indicates that the market is in a very active state, no matter whoever speaks.
6. Average Price

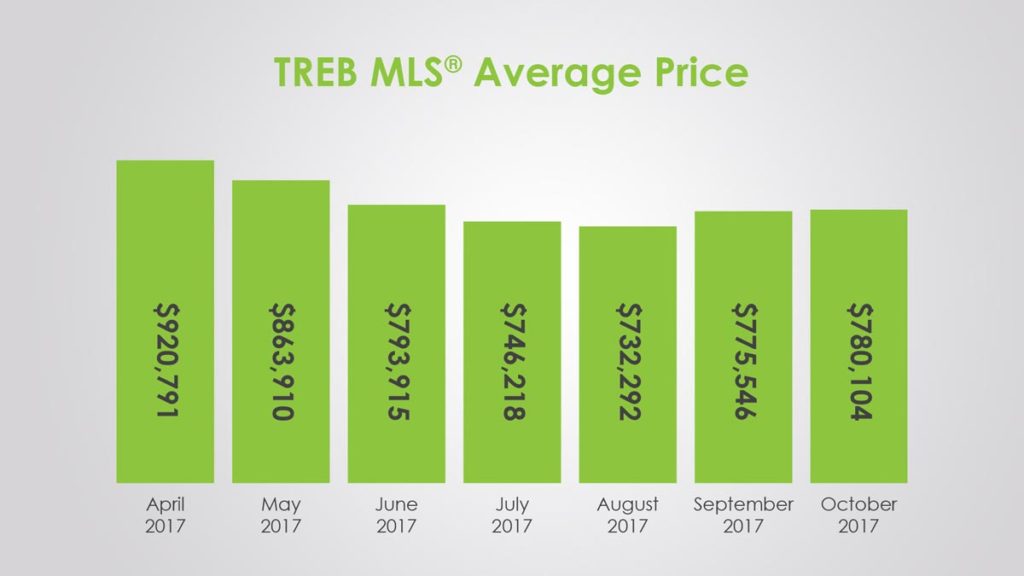
Average Price Continues Growth – $780,104!
In October 2017 the Average Price in Toronto GTA, was up by + 2.3% compared to what happened a year before. In other words, in annual terms we see the same sluggish growth, as in the previous month.
However, what pleases me is that the trend started in September continues. The average relative to the previous month increased again. This time for $ 5000. I think this fact is like a balm for everyone’s soul. The exception will be only those who are currently in the process of buying or planned it in the near future, counting on the fact that the price drop will continue.
Segmentation
On a detailed review of the dynamics of prices by segments, it is impossible to single out something particularly prominent. Still I want to note that the average price within Toronto (Area 416), for Detached house fell relative to the previous month by $ 68,000, and for Townhouse grew by $ 58,000.
But this is more likely just a conjunctural change. Nevertheless, the fact that the price of apartments in condos has not changed, in my opinion, is an indicator that the interest of buyers has shifted towards low-rise housing. This is due to the fact that prices in the Low Rise segment have fallen significantly compare to the past six months, and prices in the High Rise segment have grown so much. This is confirmed by the structure of sales, which we discussed above.
| Avg Price Toronto | Avg Price GTA | Avg Price Toronto GTA | |
|---|---|---|---|
| Detached Change year-over-year | $1,287,765 -1.1% | $910,488 -4.0% | $1,008,207 -2.5% |
| Semi-Detached Change year-over-year | $948,309 +5.2% | $636,829 +4.7% | $764,293 +6.3% |
| Townhouse Change year-over-year | $742,845 +8.0% | $592,381 +7.0% | $629,507 +7.4% |
| Condo Apartment Change year-over-year | $555,004 +20.9% | $435,142 +21.0% | $623,041 +21.8% |
7. MLS® Home Price Index (HPI)
MLS® HPI Composite Benchmark —
is an indicator that takes into account not only the price of a real estate object and its type, but also some characteristics of this property. Among these characteristics, you can distinguish such as the area square footage, number of rooms, bathrooms, garage, age of the structure, location, etc.
This index, for me personally, is much more revealing, in view of the fact that it allows to level fluctuations in the sales structure.
The MLS® Home Price Index Composite benchmark price for Toronto GTA was up by 9.7 per cent on a year-over-year basis in October.
If we consider the situation in more detail way, it becomes obvious that the growth in the average price for the HPI index is higher than the growth in the price level in direct expression. That suggests that at this moment demand is shifted to cheaper real estate segment.
At the same time, it should be noted that if the growth in the price for the HPI index in the segments Detached and Semi-Detached was about 6% in annual terms, then the Townhouse segment grew by 14%, and the Condo Apartment segment added as much as 23%.
8. Conclusion
First
First, I want to confirm once again – The bottom is Passed and all the data of the last three months say exactly this!
Second
It should be noted that the buyers’ interest returned to the Low-Rise segment. This is less pronounced in the part of Detached houses, but it is absolutely clear in the segment of Townhouse. How else? After all, prices for apartments in condominiums have grown over a six-month period by a good 20%.
For example, in October 2016, the average price of Apartments in the Condo in Toronto was $ 459,224 and the average price of the Townhouse was $ 927,471. In October 2017 these prices were $ 555,004 and $ 742,845, respectively and if for single Buyers or those families who do not have children, an apartment with one bedroom in a condo is a possible option, then for those who have at least one child a two bedroom apartment, being the necessary minimum costs almost as much as a Townhouse. Therefore, the demand shifts into the segment of the relatively inexpensive Low-Rise.
Third
In view of the above, I want to note that the very moment that I spoke about several months ago comes. A key feature of this point is that although the Real Estate Market is at first glance unified, it is still segmented, in particular, in the High-Rise and Low-Rise segments. Therefore, talking about the market as a whole is not entirely true, because trends in them are often noticeably different, and sometimes, for example, as this year, are diametrically opposed.
Imagine that these are two balls connected by an elastic band. As soon as one is severely separated from the other, they begin to approach each other, as soon as they come into contact or come very close, they begin to move away from each other. This example is very accurate, in my opinion, has shown, and still will, behave this year.
Why is this example here? To the fact that I believe that starting from this moment and in the short term, the price growth rate in the High-Rise segment will slow down a bit, and in the Low-Rise segment it will remain at the level of the last two months or slightly increase.
The fourth and the most important!
New rules for the mortgage qualification, in my opinion are already beginning to have an impact on the Toronto Real Estate Market GTA. While this is imperceptible, it will show itself more strongly in November and December. This will be expressed in the increase in the volume of sales in all segments, but more in more accessible – Condo Apartments and Townhouse. In addition, I expect some acceleration of the rate of price growth in the Low-Rise segment and the continuation of the price increase in the condominium apartments segment, although not at the same pace as in the first half of 2017.
Fifth. Vancouver Scenario.
Well, how can it be without it, even if the Toronto Real Estate Board started talking about this, although not before?
The Vancouver market has fully recovered from the shock of imposing a surtax on foreign Buyers of real estate and continues to grow. Not only sales are growing, but prices too.
Sales in Greater Vancouver in October 2017, increased by 35.3%, which is 15% higher than the average sales volume in the last ten years.
The average price for the HPI on the property in Greater Vancouver grew by 12.4% in annual terms and by 0.5% against September 2017.
Moreover, the REUTERS agency recently reported that foreign buyers are returning to the Vancouver Residential Market. In September in Greater Vancouver, they accounted for about 5% of transactions, and in such suburbs as Richmond 10.8%!
What does all this say? About the fact that Toronto Real Market should expect the same!
Recommendations
For BUYERS
Особенно тем, кто покупает свой первый дом! Бегите, Смотрите, Решайтесь, Покупайте!
Why? Because if you do not get Mortgage Approval for a particular deal before December 31 of this year, then most likely, due to the introduction of new qualification rules for the issue of mortgage, the amount you can have when buying real estate will be reduced by 15%, and in some cases, by as much as 20%. Do not count on the fact that after the new year prices will fall. Even if they dip, it will not be that much.
In doing so, do not forget to require, from your agents CMA – Comparative Market Analysis. It’s wonderful that both you and your agent know the market perfectly, but the situation changes so quickly, what is called a micro market is so heterogeneous now that it’s really difficult to keep track of all this.
For SELLERS
First
If you NEED to sell your property in the near future, put up with the fact that the market is not the same as it was in the last three years. This does not mean that it is in a bad state, just over the past few years, it has been excessively overheated. Therefore, be prepared for the fact that the sale will take much longer than before. The average rate of Days on Market is 23 days, but do not forget that the Months of Inventory is at the level of 2.6 – 3 months. In any case, I would recommend that you count on 45 days, more or less. Especially if you want to try a high price first or if you have closing another transaction for the purchase of real estate soon, for which you need money from sale of the existing home.
Second
Realize the fact, that prices began to rise does not at all mean that they quickly rushed up, not at all. Let’s say, prices stopped falling. Forget about the figures that you saw at the maximum levels in March-April this year, they have long been gone, and they were not for long enough period. It was just a temporary splash. By the way, you probably already heard a lot of stories about how these deals were then closed with discounts, and sometimes they were not even closed. So, look at the prices for which similar houses were sold in the last couple of months, this will be a good guideline.
Third
At this moment, the competition among Sellers is strong as it has not been strong for many years. So thoroughly prepare your house or apartment for sale.
Clean everything to shine, repair all the little things, and if there is a sense, then something larger, up to the replacement of household appliances or even local repairs.
Do not spare money for consultation of designer and staging, which usually not only pays off, but also brings good profit.
Well, I especially want to note such a trifle as photos. Currently, Buyers in 99% of cases for the first time see their potential purchase on the Internet. They see the photos that are attached to the listing that create the first impression, which can be decisive – they will come to see your house or, for whatever reasons, choose some other one. Do not take away your chance! Let the photos be taken by a professional photographer who has the right equipment. Smartphones now take great pictures, but it’s not just the equipment, but also the skills and experience to correctly build a frame.