Let’s add a bit of philosophy into our “recipe”! Let’s make this Market Watch in a Yin and Yang format, because usually, the same event brings something good and something bad. Ok, let’s see what happened in Toronto’s Real Estate in September 2017.
What can I say? Market Stats for September appeared quite boring. I don’t mean bad, I just think it’s boring. Boring, because for everyone who keeps an eye on Real Estate in Toronto GTA it didn’t bring anything unexpected, something what could bring some changes into the vision of the development of situation on the market. Just the one little thing, which we will talk about later.
1. Sales
Sales dropped … again
Toronto Real Estate Board reported 6,379 sales through TREB’s MLS® System in September 2017. It shows us 35.1% decrease compared to September 2016 and it is definitely not good. But, if we will look from the other side, we will see that in August 2017, we saw almost exactly the same decrease in Sales compared to the same month a year before – 34.8%. Even the nominal change in the number of sales from August to September this year and year before are quite similar. In 2016 that increase was 89 sales and in 2017 42 sales. Especially if you subtract 35% of drop in sales – 89 – 35% (31) = 58. So 58 vs 42. Isn’t it the same on the background of 6 379 of monthly Sales?
These numbers, from my point, show that Toronto GTA Real Estate Market has stabilized.

2016 was record breaking year for Toronto Real Estate
If we take this fact into consideration – decrease in Sales for 35.1% doesn’t look so dramatic.
More of it, if we will pull up the data we will see that the 10 year average for September is 7441 Sales. That means that September 2017 is just 14% below this level.
| Sales Toronto (416) | Sales GTA (905) | Sales Toronto GTA (Total) | |
|---|---|---|---|
| Detached Year-over-Year Change | 642 -41.0% | 2,138 -40.3% | 2,780 -40.4% |
| Semi-Detached Year-over-Year Change | 255 -15.3% | 384 -37.5% | 639 -30.2% |
| Townhouse Year-over-Year Change | 230 -39.9% | 768 -32.5% | 998 -34.4% |
| Condo Apartment Year-over-Year Change | 1,362 -23.2% | 498 -37.0 | 1,860 -27.5% |
2. Active Listings
The Number of Active Listings in September 2017 was 19,021.
Yes, the number of Active Listings has increased by 69% compared to September 2016. Is good or bad? For Sellers of course, it’s bad. Who likes increasing of competition? But it is definitely good news for Buyers.
By the way, the number of Active Listings at the balanced market for Toronto GTA is around 20 000 and we are just below it. Also, someone, who was waiting for an avalanche of new listings to hit the market in September, did not succeed with their expectations. Number of Active Listings in September 2017 was only 2500 up from August. Very close to last year, when this number increased by 1300.
The only thing which holds buyers from more active behavior on the market is the trend that we have had during the past 5 months. But it looks like this trend starts changing too. With coming of September we see Multiple Offers again, and I’m not talking about Toronto Downtown Condo’s. No, I’m talking about Detached homes in suburbs like Richmond Hill. Isn’t it a sign that Toronto Real Estate Market is turning, just not so many people can see that yet?
3. Sales to New Listings Ratio
38,7% – Sales-to-New-Listings Ratio in September 2017
In September 2017 we had 6 379 Sales and 16 469 of New Listings. 6379 / 16469 = 38.7%. That’s not good for the Real Estate Market. More of it, after decrease of this indicator in May 2017 to 39.5% it was continuously growing until September.
Sales to New Listings Ratio 38%, means that the Market sits on the Buyer’s side. But I think that we see such a low number by coincidence. Most of the new listings hit the Market in the second half of the month. At the same time the Real Estate Market has cooled and time of selling a home has increased. That means for me that these new listings simply didn’t have enough time to be sold. In favor of this idea speaks also the change in Average Selling Price.
4. DOM – Days On Market
DOM in September was 24 days
In September 2016, the average time frame for selling was 16 days. That means that this indicator increased by 50% and it is not good for the Market. But, if we take a look on the ten year average, which consists of 26.3 days, the picture doesn’t appear that bad, the number reported in September is even better, and we do understand that this indicator sits on the quite comfortable level.
5. Average Price
And now is the time for Dessert — Average Price!
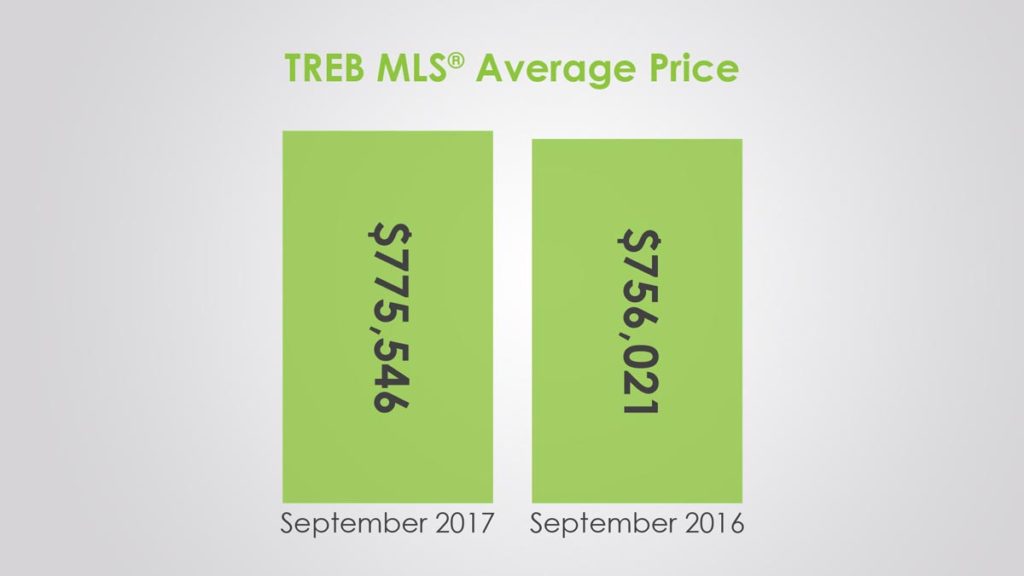
The increase of Average Selling Price in Toronto GTA compared to the year before was not impressive – +2.6%. It is a really weak growth. It is even lower than the current basic mortgage rates.
But what is more significant for me, is the nominal number – $775,546
Average Selling Price for Detached home in Toronto increased for $163,000 since August.
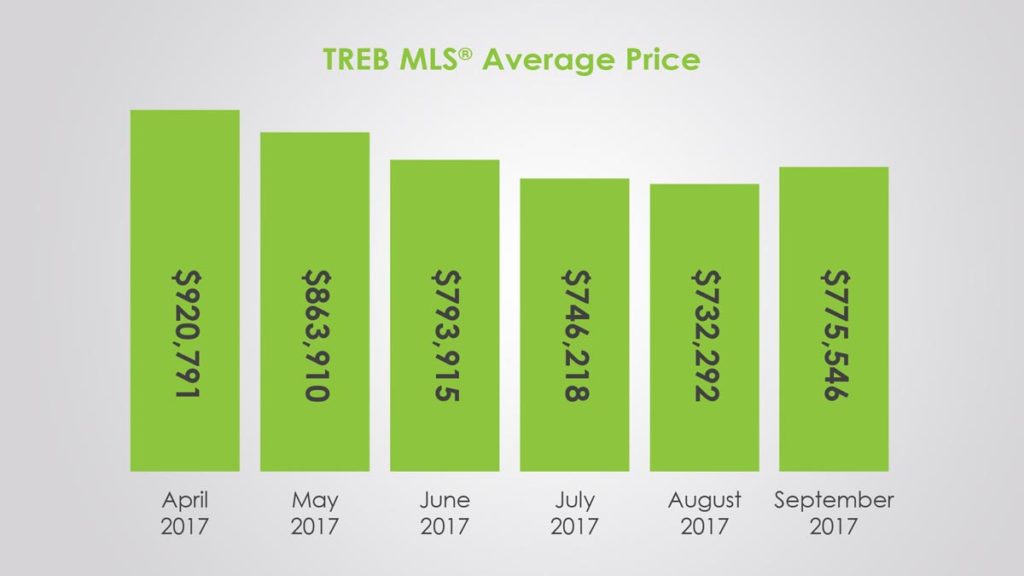
Why am I so focused on the Average Selling Price? Because it is the first time after April 2017, when it shows increase compared to the previous month. Average Selling Price gained $23 000 from August. Why?
Because the structure of demand has shifted to the Toronto’s Detached and Semi-Detached homes. Can you see what happens? Those Buyers who were waiting for another decrease of prices, understood that the most sweet deals for Detached Homes were gone in June – July and started to buy the rest of them. Mostly that happened in Toronto, where Average Selling Price for Detached Home increased in September by $163 000 compared to August, but some signs of it we can see in suburbs too.
Sale of Home at Distress Prices almost gone.
Sellers change their tactics of selling a home and don’t wait until the last moment as it was a year or two before. They start selling their home long before the deadline or even cut any selling activity till better times.
We have come through the bottom
Yes, Ladies and Gentlemen! Looking at the graph we can say that we have come through the bottom. Congratulations!
Everything was as by the book – Explosive Growth (January – April), Correction (May – July), Bottom (August).
Is it good or bad?
It’s bad, because this trend is very unstable yet. Accordingly, future trends may not be steady enough to keep this pace. Furthermore, price dip was not so big to give prices a chance to make a significant move up. It isn’t good for Buyers either, because they should be prepares to spend more to own desired property.
It is good for the Real Estate Market because price stabilization will likely push prices up again. That can bring back confidence of Investors and Creditors to Toronto’s Real Estate Market. It is definitely good for Sellers because they can get more money from their homes. It is even good for Buyers, because they will get less stress buying new homes because of the worries regarding the price they paid for new property and less risks at the stage of evaluation by the mortgage lender.
| Average Price Toronto (416) | Average Price GTA (905) | Average Price Toronto GTA (Total) | |
|---|---|---|---|
| Detached Year-over-Year Change | $1,355,234 +4.4% | $912,921 -1.7% | $1,015,067 0.0% |
| Semi-Detached Year-over-Year Change | $935,467 +5.2% | $630,797 +3.7% | $752,379 +7.4% |
| Townhouse Year-over-Year Change | $685,016 +4.8% | $586,731 +8.6% | $609,382 +7.1% |
| Condo Apartment Year-over-Year Change | $554,069 +24.0% | $428,360 +16.6% | $520,411 +23.2% |
6. MLS® Home Price Index (HPI)
Developed using data from the Multiple Listing Service®, the MLS® Home Price Index (or MLS® HPI for short) allows you to see trends in home prices for a specific type of house in a given neighbourhood.
Combined with the knowledge, experience and skills of your REALTOR®, the MLS® HPI allows you to better understand these trends — and how they can affect the market value of your home.
The MLS® HPI is based on the value homebuyers assign to various housing attributes, which tend to evolve gradually over time.
This means that price changes calculated using the MLS®HPI are less volatile than those derived using common measures like average and median, which can swing dramatically in response to changes with high-end or low-end sales volumes over time.
It is often difficult to determine if average or median price fluctuations really reflect changes in buyers’ willingness to pay for certain housing attributes, or just changes in the volume of very expensive or inexpensive home sales from one time period to the next. The MLS® HPI removes that uncertainty.
So, if we take a closer look at HPI Price change we can see that Price growth is significantly higher than 2.6%. It is 12.2%, compared to September 2016. That means the only one thing – structure of demand at Toronto Real Estate Market is shifted to lower priced properties.
The MLS® Home Price Index (HPI) Composite Benchmark Price in September 2017 was $750,800.
That is the only weird number,in my opinion in the September Stats. At the same moment when Average Selling Price went up for $23 000 compared to August, HPI Benchmark continued decrease for another $5 000.
Conclusion
Vancouver Scenario
There are many similarities in developing of the situation at Real Estate Markets of Vancouver and Toronto,but at the same time there is one difference.
The difference is concluded in the fact, that when Vancouver has implemented 15% surtax, there was no other measures for tightening Buyer’s position. On contrary, after implementing similar measures for Greater Horseshoe Area, we saw not only tightening of mortgage rules, but also increase of rates. Twice.
Maybe for that reason there was no such a significant price dip in Vancouver as in Toronto GTA. But probably the cause for Toronto’s dip
was the incorrectly chosen moment for implementing by the Government of those measures. I’m not 100% sure that it’s done unintentionally though.
We have come through the bottom
Many facts play in favor of the idea that we have come through the bottom. I don’t think that Toronto’s Real Estate Market will start to grow immediately. But I’m sure that this trend has already turned and now is moving to the direction, which is opposite to the one we had for last 5 months. At the same time, as longer prices will sit at the current levels, the growth we will have after will be stronger.
Mostly I’m talking about Low Rise segment. The first sign we saw in September, was sharp growth of Average Price for Detached homes in Toronto – $163 000 compared to August. We all know that in the Toronto GTA Market everything starts from downtown and after as circles from the dropped into the lake stone,goes to the edges of Toronto GTA. As proof of it – increase of Average Selling Price for Detached homes in Toronto’s suburbs for $6 000 compared to month before.
Bank of Canada becomes reasonable
As long as many analytics were predicting, one more rate increase and two more in 2018. After many brave and optimistic speeches about the strong growth trend in Canadian economy. On September 27th, Bank of Canada Governor Stephen Poloz looked to temper recent optimism over the Canadian economy. In comments to a local trade organization in St. John’s, N.L., Poloz said there was “no predetermined path” for interest rates in the second half of 2017 and beyond. He also said rising household debts in Canada leave the economy exposed to anything from higher housing prices to an uptick in unemployment levels.
“The Canadian economy is not well prepared for a negative shock to the economy,” Poloz said.
Really? Didn’t we say exactly the same thing after the first rate hike this year? But, whatever, they started to think and that’s the best what could happen.