As winter does not rush to retreat, neither does the Real Estate Market of Toronto GTA, doesn’t hurry to loosen. Yesterday TREB published statistics for March 2018-year. What is interesting?
The implementation of new mortgage qualification rules, combined with an increase in interest rates played a role, pushing away a part of potential buyers who decided to delay with active actions.
At the same time, the Sellers, too, are not in a hurry to enter the market, expecting a return to peak prices of last year.
Those who are familiar with the data for February of 2018, will easily find that the nominal figures in the Toronto GTA Real Estate Status Report have changed, but the relative values in comparison with the previous year practically repeat the previous report. Therefore, there are no surprises in this part. Another thing is interesting. What will this state of affairs bring us to? It can turn out the same way as with the weather this year – from “Winter” and directly into “Summer”.
1. Sales
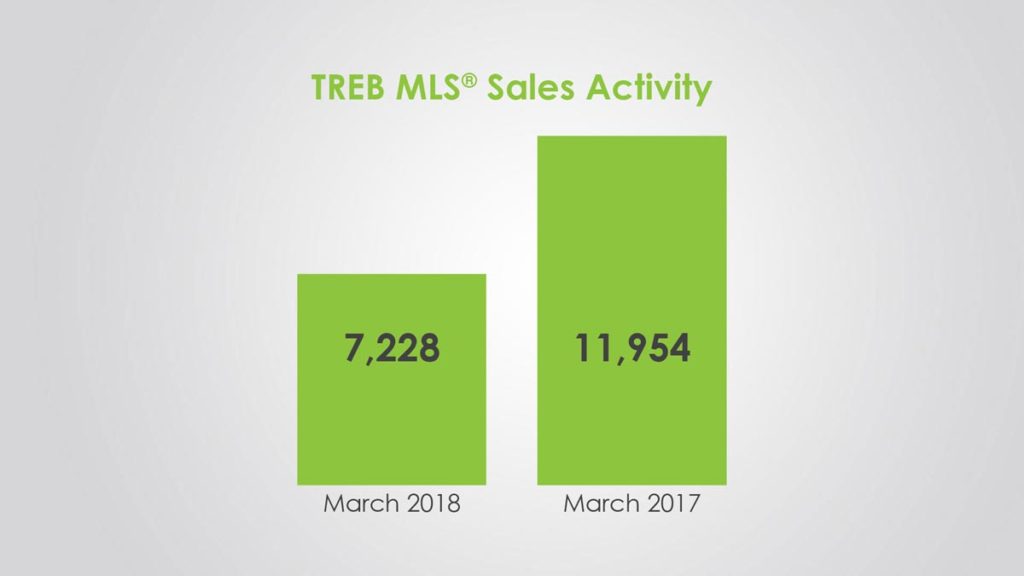
Sales in March 2018 were down by 39,5%
compared with the same period of 2017. At the same time in February, the fall was 34.9%. And it seems that the 5% difference is a fairly significant amount, but I would not say that between the data for the past two months, there is much differences. Why?
Because if in February of 2017 there was more supply, then sales would be higher, which in would show a greater relative decline in sales of February. That is why I think these numbers are just as equivalent.
Almost half decline in Sales – that’s bad, but expected!
It is expected because the sales in March of 2017 reached record levels and of course, at this background, the drop looks even more significant.
In March 2018 Toronto Real Estate Board reported 7,228 residential transactions.
and down 17.6 per cent relative to average March Sales for the previous 10 years.

Segmentation of Sales
Now, let’s look at the structure of Sales.
| Sales Toronto | Sales GTA | Sales Toronto GTA | |
|---|---|---|---|
| Detached Change year-over-year | 706 -41.1% | 2,414 -47.7% | 3,120 -46.3% |
| Semi-Detached Change year-over-year | 236 -28.5% | 450 -31.6% | 686 -30.6% |
| Townhouse Change year-over-year | 260 -27.8% | 450 -31.6% | 686 -30.6% |
| Condo Apartment Change year-over-year | 1,573 -32.0% | 610 -34.7% | 2,183 -32.7% |
Changes in the structure of demand are not observed.
The structure of demand for the segments, during the month almost did not change. Notable differences are that with an average drop of 5%, the demand for Detached homes within Toronto declined by just 7.5%. In the suburbs, demand for Townhouses sank by 9.5%.
2. Active Listings
The number of Active Listings is what determines how wide is the choice of properties for Sale. Of course, the more choices, the more comfortable the position of the Buyer and vice versa, the lower the supply on the market, the stronger the position of the Seller.

The number of active listings on the market in March of 2018 was 15,971 units.
More than double growth – + 103%, relative to last year’s result, in the same period. This number of listings looks impressive against the background of 2017, when the buyer could choose from only 7,856 listings. But this is far from a record. A record, if you are suddenly interested, was in March of 2009 – 23,642 (!) Listings. Moreover, the result of March of 2018, even lower than the average for the last decade by 3%.
That gives a reason to the authorities and some analysts to say that even though the demand for Real Estate in Toronto GTA is small, the supply in the market is still inadequate.
3. Sales to New Listings Ratio
The sales-to-new–listings ratio compares the number of sales to the number of new listings. Expressed as % ‘age, it helps clarify if market conditions are balanced or tipped toward a seller’s or buyer’s market.
48,6% – Sales-to-New-Listings Ratio (SNLR) in March 2018
Let me remind you that the market is considered balanced, when this indicator is in the range of 50-55%. If this indicator is higher, then this indicates that the market favors the seller. So at the moment, the market is still more in the hands of the Buyer than the Seller.
This indicator is slightly below the February values (49.2%), but it does not change the essence. The market still, though not much, favors the buyer.
4. DOM (Days on Market)
20 days was required to sell the house in March of 2018.
In March of 2017, the average selling time was only 10 days. The reason for this was that there was a shortage of new listings. In the past month, the DOM indicator has doubled, stopping at 20 days. The increase in the selling time in percent looks frightening, but in pure figures, it is quite a normal result, especially taking into account the seasonality.
5. MOI — Months of Inventory

Months of Inventory in March 2018 dropped to 2,2
We have not seen such low values of this indicator for almost a year. At the same time I would like to recall that the value of this indicator is less than 3, which indicates that the activity in the Real Estate Market is high.
6. Average Price

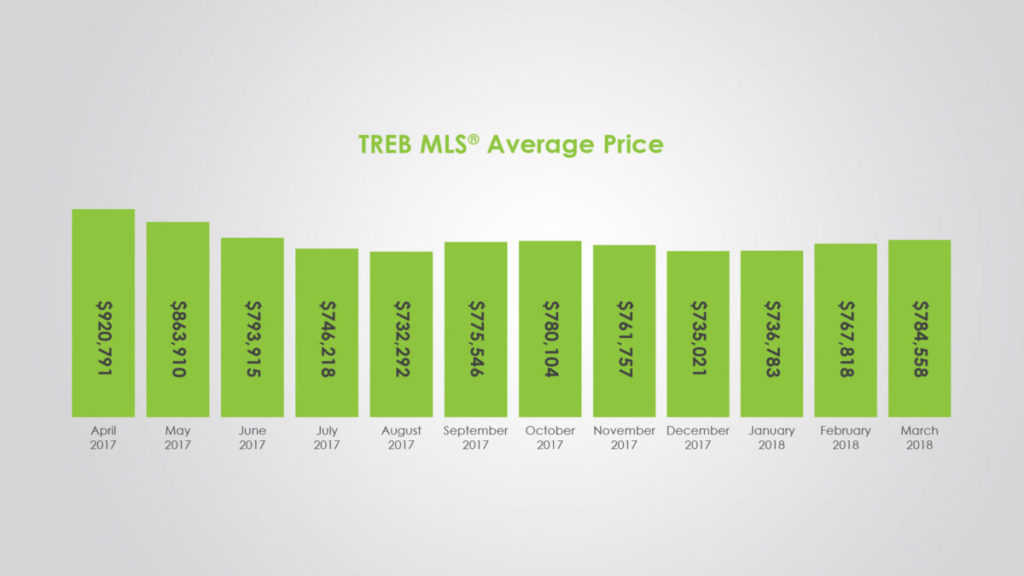
The average price in March of 2018 was $ 784.558, down 14.3% year-over-year.
At the same time last month, the drop was 12.4%. As expected, in the next couple of months, this indicator will show impressive negative values when compared with the data of a year ago.
What if you stop wailing and look at the dynamics of prices in recent months?
In this case, it will turn out that the Average Price of a Residential Property in Toronto GTA, in March of 2018 is the highest for the last 9 months. Moreover, it is growing for the fourth month in a row. And please note that this is against the backdrop of all the events that have occurred in the mortgage market!
Segmentation
| Avg Price Toronto | Avg Price GTA | Avg Price Toronto GTA | |
|---|---|---|---|
| Detached Change year-over-year | $1,293,903 -17.1% | $921,515 -17.9% | $1,005,779 -17.1% |
| Semi-Detached Change year-over-year | $1,032,358 -5.0% | $651,967 -12.4% | $782,831 -8.8% |
| Townhouse Change year-over-year | $735,650 -3.5% | $609,375 -11.7% | $638,558 -9.5% |
| Condo Apartment Change year-over-year | $590,184 +7.1% | $449,967 +2.1% | $551,003 +6.1% |
What is worth highlighting
From the whole table of prices it follows that the basic prices for the month increased by about $ 10,000 – $ 15,000. However, at the same time, several positions are knocked out of the general series. The first is that the Semi Detached in Toronto has increased against the previous month, by almost $ 50,000, breaking the bar of $ 1 million along the way. Second – Average Price Condo Apartment, after several months of idling, immediately increased by $ 20,000 within Toronto, $ 15,000 in suburbs and $ 30,000 if you take the entire territory of Toronto GTA. The average price for a Townhouse within Toronto fell by $ 41,000. For whatever reason, I still do not understand.
7. MLS® Home Price Index (HPI)
HPI (Home Price Index) is an indicator that takes into account not only the price of a real estate object and its type, but also some characteristics of this property. Among these characteristics, you can distinguish such as the area square footage, number of rooms, bathrooms, garage, age of the structure, location, etc.
This index, for me personally, is much more revealing, in view of the fact that it allows to level fluctuations in the sales structure.
The MLS® Home Price Index Composite benchmark price for Toronto GTA was down by 1,5%, on a year-over-year basis concluded $760,800
According to the HPI index, the Average Price in March of 2018, declined in annual terms by 1.5%, to $ 760,800. This is the first decline in the average price for the HPI index relative to the same period last year.
However, there is good news – this is $ 9,000 more than the previous month. Thus, both the real Average Price and the Price on the HPI Index continue to grow in recent months.
8. Conclusion
First
What Caused a Decrease in Sales? Such a significant drop in sales volumes, -39.5% compared to March 2018, is explained by the introduction of the New Rules of Mortgage Lending, which undoubtedly left a huge part of the Buyers overboard. However, we expected this.
Also, we can not discount the increase in interest rates.
Second
The number of Active Listings is at rather low levels – 15,971, as for normal conditions in the Toronto GTA Real Estate Market, there must be no less than 20,000. Why is this happening? This is because the Sellers, remembering last year’s price peaks, do not want to cut prices. At the same time, the Buyers have an erroneous opinion that the prices for Real Estate in Toronto GTA continue to decline. Although this has been wrong for many months. Moreover, quite in contrast to this perception – the prices have been rising and for more than one month in a row.
Third
At the same time, the number of New Listings is at a sufficient level of 14,866. Moreover, if the number of Active Listings is 15,971, then logically it would have turned out that we and Sales at the same level? But no! Why does this happen? Because Sellers enter the market with some strategy and if they do not sell in the first 3-4 weeks, they change the strategy, withdraw from the sale and relist their home again. Usually the reason for failure is an excessive price. As a result, the market is flooded with the same houses. And so on until they are sold.
Fourth
The average price increased by $20,000 in relation to the previous month. In addition, the Average Price has been rising for the fourth consecutive month and is at its highest values in the past nine months.
Summary
Sales, compared to the record values of the previous year, are falling, but at the same time prices are rising and the market lacks supply (MOI – 2.2 months). And all this against the background of the strongest tightening of the Rules of Mortgage Lending. At the same time, at least half the population, believes that prices are falling.
Where it will bring us to?
To the fact that by the end of the summer, the public will understand that the Toronto Real Estate Market GTA, does not fall, but quite on the contrary and will begin to act. Which will lead not only to an increase in activity, but also to the rise of prices. Small, but enough to talk about it.
All of the above has nothing to do with expensive and extra expensive Detached homes, with a price close to $ 2 million and higher. They will be under extremely high pressure.
On this note, I conclude my review of the Toronto GTA Real Estate Market for March 2018. If you have questions – do not hesitate to call and write!
Please, leave your comments and share your ideas.
- 133 Aishford Rd., BradfordMeet my New Listing
- 949 Langford Blvd, BradfordGorgeous 2 Yrs New Home on Huge Premium Corner lot with 134′ depth, 45’ front and 79’ back!
- 25 Deer Hollow Crt, Bolton, Ontario, L7E 1T2Very Rarely Can You Purchase A Home Like This One! Backing Onto Ravine! Great Neighbourhood With Walking Trail And Park. This True Entertainer’s Home