Hello, dear friends! Well, February came, and so we had the first data on how the real estate market behaves in the coming year 2018. In short, nothing unexpected happened. Perhaps, everything is even slightly better than I expected.
Contrary to the hysteria in the press, in particular here and here, I believe that proceeding from the situation that has developed in the last months of the past year, everything is developing quite well.
It should be noted that developers have become more accommodating, some even tempered their appetites in terms of conditions in the Pre-Construction projects, dropping the down payment to 21%, compared with the usual 25% previously. Some of them, in particular TRIDEL, at the presentation of the second phase of the AUBERGE II project, told us absolutely directly that sales will not be based on the First Come – First Served principle, but on the quality of clients, in other words, by the criterion of how reliable in the financial plan the buyer.
Well, all right, let’s move on to the numbers!
1. Sales
Sales in January 2018 were down by 22%
compared with the same period in 2017. At first glance, it may seem that here it has come – the collapse. But do not hurry.
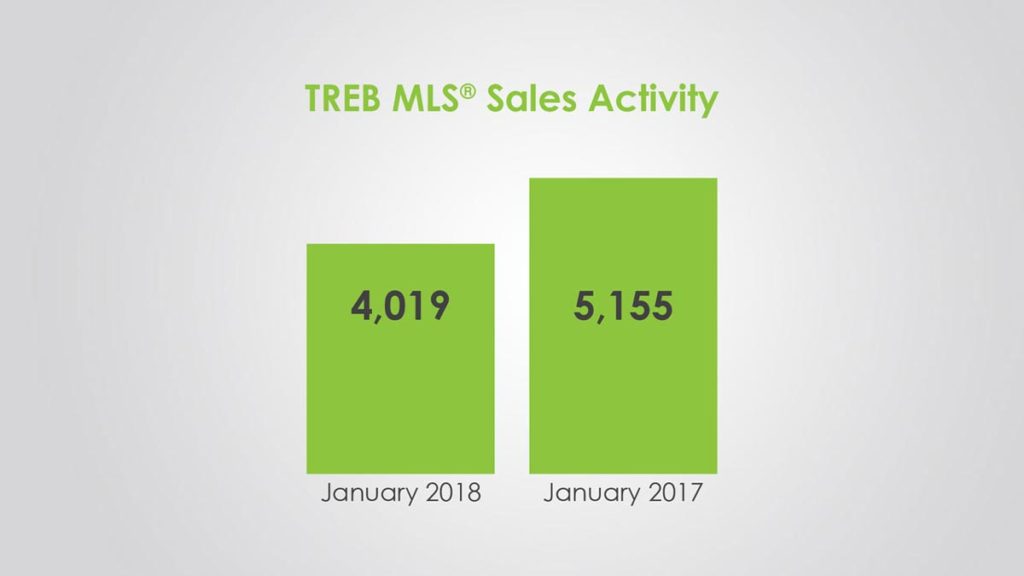
First, January 2017, was a record year in terms of sales.
Therefore, falling against its background, does not look so catastrophic.
Second, the average sales volume for the last ten years for January is 4,251.
Thus, we are only 5.7% below the average.
Third – January, however far from an indicator of the state of the market
, but on the contrary, one of the most inactive months in the year.
Fourth
If we consider the fall in sales that was noted after the introduction of Fair Housing Plan, April 20, 2017, we will see that the drop in sales is by no means the most significant. In the summer, we saw 35, and even 40 percent drop.
The last … It could be worse.
Given all the vicissitudes in the Toronto Real Estate Market GTA, plus tightening the rules for issuing mortgage loans, as well as another increase in the base interest rate, it was not surprising that those who were ready to buy tried to make the deal before the introduction of the new rules, e. before the New Year. So it pushed, those Buyers who wanted to wait a couple of months, to a quicker decision. It is logical that as a result, we got quite optimistic results in the last quarter of 2017 and even more logical, it would be expected that this fact will reduce activity in the first quarter of 2018. And against the backdrop of the fact that January is already extremely inactive in terms of sales a month, we could easily and up to 3,000 transactions do not reach.
So in general, everything is much better than expected.
Segmentation
With the reasons for the drop in sales, we seem to have figured it out. Now, let’s look at the structure of sales.
| Sales Toronto | Sales GTA | Sales Toronto GTA | |
|---|---|---|---|
| Detached Change year-over-year | 376 -18.3% | 1,283 -28.0% | 1,659 -26.0% |
| Semi-Detached Change year-over-year | 94 -19.7% | 270 -10.6% | 364 -13.1% |
| Townhouse Change year-over-year | 138 -22.9% | 537 -9.4% | 675 -12.6% |
| Condo Apartment Change year-over-year | 899 -19.8% | 376 -26.4% | 1,275 -21.9% |
Return of interest to the Low Rise segment continues
Considering the structure of sales, I want to note the emerging trend towards the return of buyers’ interest in the Low-rise segment. But this does not apply to the entire segment, but only to a lower price range. (Looking at prices, the language does not turn, say “cheap”). This trend continues for the last four, and possibly six months.
For example, during all summer months, the drop in sales in the segment of Detached homes reached 60%. In September of 2017, it was already 40%. In October, 30%, in November 19%, and in December, and at all 13.6%.
The Townhouse segment felt better than everyone in the Low Rise, and by December 2017 sales increased by 12%. In January of 2018, the decline in sales in the segment of townhouses was -12.6%. But I want to note that if during the first 9 months of 2017, the demand for Low-Rise felt better in Toronto, then by the end of the year it began to shift to the suburbs. That again says that Buyers are just looking for the cheapest options.
Against the background of all of the above, the fall in sales of Condo Apartment, looks depressing. But this does not mean that it is illogical. The fact is that while the entire Low Rise segment became cheaper, apartments in Condo grew. Moreover, they grew at a very noticeable rate. Therefore, they simply lost their attractiveness. And the price increase in this segment will depend on the prices in the Low-Rise segment.
2. Active Listings
The number of Active Listings is what determines how wide is the choice of properties for Sale for Buyers. Of course, the more choices, the more comfortable the position of the Buyer and vice versa, the lower the supply on the market, the stronger the position of the Seller.

The number of active listings on the market in January of 2018 was 11,894 units.
More than twofold growth (+ 136.3%), relative to last year’s result, in the same period. This number of listings looks impressive against the backdrop of 2017, when the buyer could choose from only 5,034 listings. But this is far from a record. A record, if you are suddenly wondering, was in January 2009, 21,143 (!) Listings. Moreover, the result of January 2018 is even lower than the average for the last decade, which is 12,192 units.
It is this that gives reason to the authorities and some analysts to say that even though the demand for Real Estate in Toronto GTA is not large, but the supply in the market is still inadequate.
3. Sales to New Listings Ratio
The sales-to-new–listings ratio compares the number of sales to the number of new listings. Expressed as % ‘age, it helps clarify if market conditions are balanced or tipped toward a seller’s or buyer’s market.
46,8% – Sales-to-New-Listings Ratio (SNLR) in January 2018
Let me remind you that the market is considered balanced, when this indicator is in the range of 50-55%. If this indicator is higher, then this indicates that the market favors the seller. But in this case it’s just a coincidence and few people will come to mind thoughts that say that the market is on the side of the seller. Most Realtors will agree that the Real Estate Market in Toronto GTA, is still biased towards Buyers.
Does this mean that the market has shifted towards Buyers? I think that it is in a fairly balanced state, but the numbers still say that it is slightly biased towards the Buyers.
4. DOM
32 days was required to sell the house in January of 2018.
In January of 2017, Real Estate in Toronto GTA, on average sold for 19 days. In the past month, the average selling time was 32 days. The increase in the Average Time of Sales of a Real Estate Object is 68%, this is real much. But we have already said that these are the side effects of that spate of activity in the Toronto Real Estate Market of the GTA, which we observed in the last quarter of 2017.
5. MOI — Months of Inventory

Months of Inventory in January 2017, increased to 3
The second month in a row, this indicator is growing relative to the previous month. This of course is not good, but, like the previous paragraph, I say that this is just a conjuncture and globally, this fact does not mean anything yet.
6. Average Price
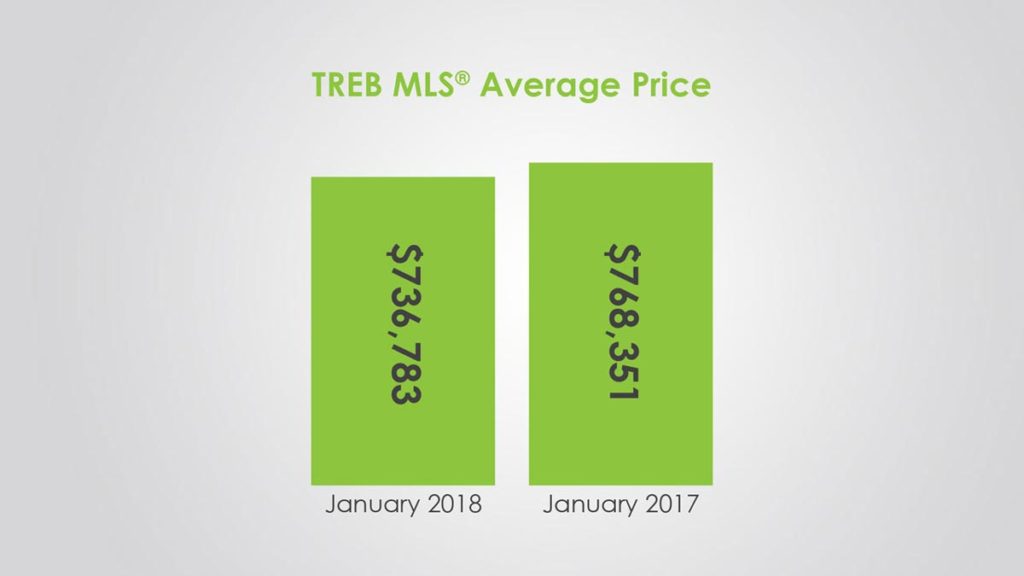
The average price in January of 2018 fell by 4.1% to $ 736.783
This figure is of course slightly higher than in was in December of 2017, but compared to last year, the Average Sales Price decreased by 4.1%. This fact speaks not in favor of the fact that Real Estate prices are rapidly declining, as some are trying to interpret it, but in favor of the fact that Buyers are focused on cheaper Real Estate options.

Segmentation
With a detailed review of the dynamics of prices by segments, it can be noted that the average selling price in the segment of houses Detached, even lower than the one that was marked a year ago, by a notable -9%.
The average selling price for all types of Real Estate in the Low-Rise segment has decreased relative to not only the peak prices of 2017, but also relative to the previous month. Thus, the forecast was confirmed that if you were going to sell the Property in the near future, then it was better to do it before the New Year 2018.
At the same time, it would be incorrect to say that the real price of houses has become lower than it was a year earlier. It’s just a sales structure that reflects the demand for cheaper real estate.
| Avg Price Toronto | Avg Price GTA | Avg Price Toronto GTA | |
|---|---|---|---|
| Detached Change year-over-year | $1,283,981 -3.9% | $879,048 -12.0% | $970,823 -9.1% |
| Semi-Detached Change year-over-year | $936,623 +3.7% | $638,899 -3.4% | $715,784 -1.8% |
| Townhouse Change year-over-year | $712,186 +8.2% | $588,439 -2.7% | $613,739 -0.5% |
| Condo Apartment Change year-over-year | $543,279 +15.1% | $421,927 +11.3% | $507,492 +14.6% |
The growth of prices in the Condo Apartment segment is exhausted.
Prices for Condo Apartment are so close to the price of Townhouses that the first, cease to be attractive. In view of this, I believe that the price increase in this segment has exhausted itself and will not resume until the rise in prices in the Low Rise segment begins.
7. MLS® Home Price Index (HPI)
HPI (Home Price Index) is an indicator that takes into account not only the price of a real estate object and its type, but also some characteristics of this property. Among these characteristics, you can distinguish such as the area square footage, number of rooms, bathrooms, garage, age of the structure, location, etc.
This index, for me personally, is much more revealing, in view of the fact that it allows to level fluctuations in the sales structure.
The average price for the HPI index is up by 5.16% to $743,500
According to the HPI index, the average price in January of 2018, grew year-on-year by 5.16%, to $ 743,200. But this is $ 200 less than the previous month. Thus, the real Average Price, almost equal to the Price on the HPI index. But as you can see, it has not fallen yet in the last months. In the spring, we will undoubtedly see negative values of growth in annual terms. But this is caused by nothing else than a sharp price jump, which was only for 2-3 months, at the beginning of 2017.
8. Conclusion
First
What Caused a Decrease in Sales?
The fall in the volume of sales in January of 2018 is due to a surge in sales in the last quarter of 2017, which is why those buyers who were thinking about buying Real Estate hurried. So now we will wait for spring to level this gap in the hull of the vessel called Real Estate Toronto GTA.
Second
The second conclusion is that the price increase in the Condo Apartment segment, has now exhausted itself. The next stage of the rise in prices for apartments will come only when the gap between prices for apartments and townhouses will increase significantly.
On this note, I conclude my review of the Toronto GTA Real Estate Market for January 2018. Now it will be interesting! Watch the market! if you have questions – do not hesitate to call and write!
See you soon!
Please, leave your comments and share your ideas.
- 55 Mercer St., #2212, TorontoExperience the ultimate “10-Minute Lifestyle” at the prestigious 55 Mercer. Perched on a high floor, Suite 2212 offers a bright south-facing exposure with breathtaking panoramic views of the CN Tower, Rogers Centre, city skyline, and glimpses of the lake through dramatic floor-to-ceiling windows.
- 77 Trail Blvd, SpringwaterThat’s what the True Luxury Estate is: 4,076 sq ft 5-Bedroom* Albany Model by Tribute Homes, set on an expansive flat 62 x 147 ft lot in Stonemanor Woods Community. This home will impress you with a throughout Smooth Ceilings: 9ft high Ceiling on the Main and 2nd floor, Crown Mouldings, Upgraded Trim, Pot Lights, Hardwood Floors, Custom Cabinetry and Closets throughout.
- 50 Sydie Lane, TottenhamBeautiful Newer Subdivision in charming Town of Tottenham! 2-storey Brick home with 3 Bedrooms, 3 Bathrooms, and a Family Room. Enjoy Summer Morning Coffee or Evening Glass on the Covered Front Porch. Open Concept Layout w 9ft Ceiling on Main Floor & Large Windows That Fill The Home With Natural Light.
- 28 Fortis Cres, BradfordModern, Bright & Fully Furnished 3-Bedroom, 3-Bath Semi-Detached On An Oversized Pie-Shaped Lot! Spacious Open-Concept Layout With Large Windows, 9ft ceiling and Hardwood Floors On The Main Level, An Upgraded Kitchen With Quartz Countertops, Stainless Steel Appliances, Breakfast Bar, And Walk-Out To A Deck With Pergola. Enjoy A Separate Dining Room Perfect For Entertaining. Second-Floor Laundry Adds Convenience. The Landscaped Backyard Is A True Green Oasis With A Pond, Waterfall, And Stylish Backyard Studio Plus A Shed, Natural Gas BBQ Line. New Fiberglass Front Door With Biometric Smart Lock (Camera, Fingerprint & Fob Access). 4-Car Parking Included. Prime Location Near Bradford GO, Hwy 400, Schools, Parks, Trails, Shopping & More!
- 7950 Bathurst St., #201. ThornhillStunning 2-bedroom, 2 full bathroom residence in The Thornhill a thoughtfully designed, 3.5-acre master-planned community by Daniels. Just 1 year new, this beautifully maintained unit offers 1,106 sqft of total living space, including a private 360 sqft terrace with peaceful courtyard views